Launch scope
Start with the products and rooms that are ready, not the entire catalog.
Case studies
These examples are anonymized, but the pattern is concrete: launch a focused workflow, measure the first useful signals, then expand only where the product changes real buyer behavior.
Launch scope
Start with the products and rooms that are ready, not the entire catalog.
Buyer signal
Look for clearer size, fit, and placement decisions before claiming broad conversion lift.
Team workflow
The best proof is a process merchandising, sales, and support can keep using.
Sales signals
Treat these as pilot targets, then replace them with your own data after launch. The goal is to measure movement toward purchase, not just a prettier product page.
+18%
Add-to-cart after interaction
A practical pilot target for shoppers who open and use the room preview.
2.4x
Product comparison depth
More size and placement checks before the buyer leaves the product page.
-24%
Vague fit questions
Fewer support conversations that start with uncertainty about scale or room fit.
Pilot sales chart
Example measurement model for a focused launch cohort.
Baseline
Pilot signal
Cart rate
7.8%
Quote/sample
3.1%
Preview use
22%
Confidence
35%
Week 2
Pilot signal
Cart rate
8.6%
Quote/sample
3.8%
Preview use
30%
Confidence
41%
Week 4
Pilot signal
Cart rate
9.4%
Quote/sample
4.6%
Preview use
36%
Confidence
46%
Week 8
Pilot signal
Cart rate
10.2%
Quote/sample
5.4%
Preview use
43%
Confidence
51%
Quarter
Pilot signal
Cart rate
11.4%
Quote/sample
6.2%
Preview use
48%
Confidence
55%
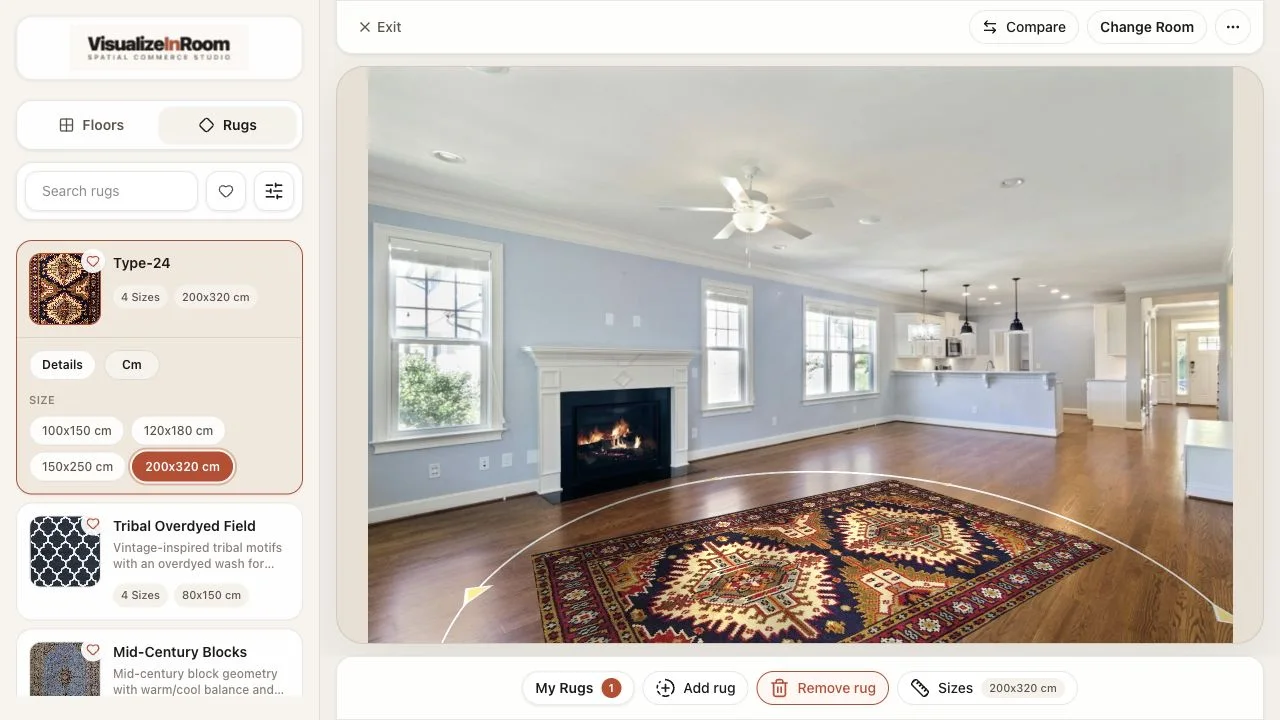
Ecommerce rollout
The first launch used room-ready top sellers with clean imagery, known dimensions, and clear merchandising ownership.
Launch path
Prioritized a smaller product slice instead of forcing the full long-tail catalog into the first release.
Measured first
Visualizer starts, engaged sessions, add-to-cart behavior, and the quality of shopper support questions.
Early signal
Fewer vague size questions and more confident comparison behavior across the selected collections.
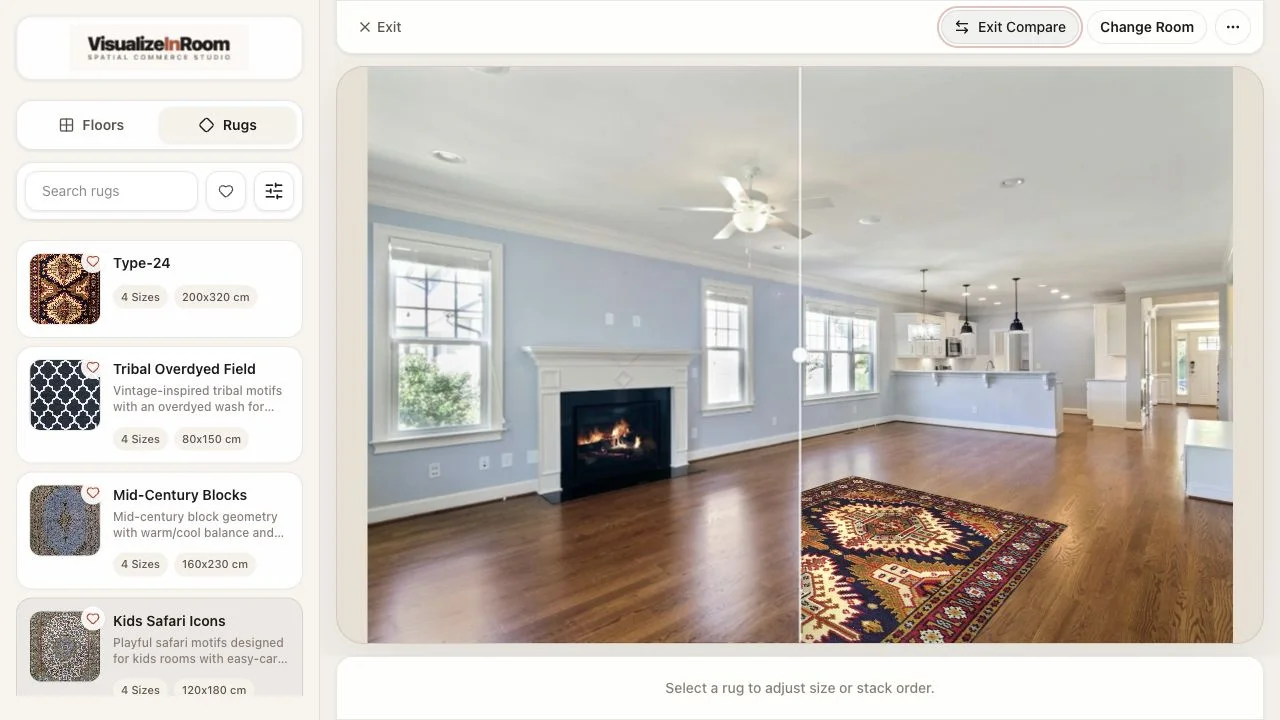
Assisted selling
The platform gave staff and customers one shared visual reference during product comparison and follow-up.
Launch path
Combined mobile room upload with a larger screen review flow for in-store conversations.
Measured first
Which comparisons moved to samples, quotes, or follow-up without restarting the conversation.
Early signal
Shorter explanation loops, more intentional samples, and clearer product fit discussions.
Book demo
Review your catalog, first launch scope, and which signals are worth measuring before rollout.